Stellar Evolution: HR Diagrams

The star clusters shown are NGC 3293, NGC 3960, and NGC 5024 respectively.
Have you ever looked up at the night sky and felt a sense of wonder at the thousands of stars twinkling above us? These celestial objects have fascinated humans for centuries, inspiring countless myths, legends, and scientific discoveries. Today, astronomers continue to study the stars using a variety of tools and techniques, one of which is the HR diagram.
HR diagrams, named after astronomers Ejnar Hertzsprung and Henry Norris Russell, are a powerful tool for understanding the properties and evolution of stars. They plot a star's surface temperature on the x-axis and its luminosity on the y-axis, creating a scatter plot of data points that reveal patterns and trends in the behavior of stars.
These diagrams are like a window into the complex and fascinating lives of stars. By analyzing the position of a star on an HR diagram, astronomers can learn about its age, mass, size, and evolutionary stage. They can identify main sequence stars, which are young and still burning hydrogen in their cores, as well as red giants, white dwarfs, and other types of stars that have evolved off the main sequence.
But HR diagrams are more than just a scientific tool. They are a reminder of the beauty and mystery of the cosmos, a way of exploring the depths of the universe and discovering the secrets of the stars. In this blog post, we'll dive into the world of HR diagrams and explore the properties of three star clusters: NGC 5024, NGC 3960, and NGC 3293. These clusters provide a glimpse into the lives of stars in different stages of their evolution, from young, hot stars to old, evolved stars. So buckle up and get ready for a journey through the cosmos!
What are HR Diagrams
HR diagrams, short for Hertzsprung-Russell diagrams, are graphical representations of the properties of stars. They plot a star's surface temperature on the x-axis and its luminosity (or brightness) on the y-axis. The resulting scatter plot of data points reveals patterns and trends in the behavior of stars, allowing astronomers to study their properties and evolution.
The temperature of a star is a measure of its surface heat, while its luminosity is a measure of its total energy output. By plotting these two properties on an HR diagram, astronomers can learn about the various stages of stellar evolution.
The most prominent feature of an HR diagram is the main sequence, which is a diagonal band that extends from the upper left (hot and luminous) to the lower right (cool and dim) of the diagram. This band represents the region where most stars spend the majority of their lives, burning hydrogen in their cores to produce energy. The exact position of a star on the main sequence depends on its mass, with more massive stars appearing brighter and hotter than less massive ones.
Other features of HR diagrams include red giants, which are old stars that have expanded and cooled, and white dwarfs, which are the remnants of low-mass stars that have exhausted their nuclear fuel. Red giants are located above and to the right of the main sequence, while white dwarfs are located below and to the left. These features reflect the various stages of stellar evolution that stars go through as they age and burn through their nuclear fuel.
HR diagrams are a powerful tool for understanding the properties and evolution of stars. By analyzing the position of a star on an HR diagram, astronomers can learn about its physical properties and use that information to test theories of stellar evolution. They can also use HR diagrams to study star clusters, which are groups of stars that are born together from the same cloud of gas and dust. In the next section, we'll explore the main sequence in more detail and how it relates to stellar evolution.
The Main Sequence and Stellar Evolution
The main sequence is the most prominent feature on an HR diagram, representing the region where most stars spend the majority of their lives. The position of a star on the main sequence depends on its mass, with more massive stars appearing brighter and hotter than less massive ones.
Stars on the main sequence are in a state of hydrostatic equilibrium, where the inward pull of gravity is balanced by the outward pressure of nuclear fusion in their cores. The temperature and pressure in a star's core are high enough to allow hydrogen atoms to fuse together into helium, releasing energy in the process.
As a star ages, it burns through its nuclear fuel and evolves off the main sequence. For low-mass stars like the Sun, this process can take billions of years. As a star exhausts its hydrogen fuel, the core contracts and heats up, causing the outer layers of the star to expand and cool. This expansion causes the star to become a red giant, which is a large, cool star with a relatively low surface temperature.
High-mass stars, on the other hand, evolve more quickly and end their lives in spectacular explosions called supernovae. These explosions are some of the most energetic events in the universe, releasing huge amounts of energy and creating heavy elements like gold and platinum.
The position of a star on an HR diagram can reveal its stage of evolution and provide clues about its ultimate fate. For example, stars above and to the right of the main sequence are typically red giants, while stars below and to the left are white dwarfs. By analyzing the properties of stars at different stages of their evolution, astronomers can learn about the physical processes that govern the lives of stars and the formation of the elements that make up the universe.
Star Clusters and hr diagrams
Star clusters are groups of stars that are born together from the same cloud of gas and dust. They are valuable tools for studying the properties and evolution of stars, as they provide a large sample of stars that share similar ages and chemical compositions.
HR diagrams are particularly useful for studying star clusters, as they allow astronomers to identify patterns and trends in the behavior of stars within the cluster. By analyzing the positions of stars on an HR diagram, astronomers can learn about the age, mass, and evolutionary stage of the stars in the cluster.
There are two types of star clusters: open clusters and globular clusters. Open clusters are relatively young, with ages typically ranging from a few million to a few billion years. They contain up to a few thousand stars and are typically found in the plane of the Milky Way galaxy. Globular clusters, on the other hand, are much older and contain hundreds of thousands of stars that are packed tightly together in a spherical shape. They are typically found in the halo of the Milky Way and can be billions of years old.
HR diagrams provide a powerful way to study the properties of stars in both types of star clusters. For example, the HR diagram of an open cluster can reveal the main sequence of stars, as well as any red giants or white dwarfs that have evolved off the main sequence. By comparing the positions of stars in different open clusters, astronomers can learn about the differences in their ages and chemical compositions.
The HR diagram of a globular cluster is different from that of an open cluster, as most of the stars in a globular cluster are old and have evolved off the main sequence. The HR diagram of a globular cluster typically shows a dense cluster of stars in the lower right corner, representing the white dwarfs that have formed from the low-mass stars in the cluster. Above this dense cluster, there is often a "horizontal branch" of stars that have evolved off the main sequence and are burning helium in their cores.
Overall, HR diagrams provide a powerful way to study the properties and evolution of stars in star clusters. In the next sections, we'll explore three specific star clusters and their HR diagrams: NGC 5024, NGC 3960, and NGC 3293.
Contructing the image and the hr diagram
Our team of amateur astronomers recently embarked on an exciting project to image and analyze three different star clusters using Skynet telescopes, as well as archival data from Gaia and 2MASS. In this blog post section, we'll describe how I combined these data sets to construct stunning, high-resolution images of each cluster, revealing their intrinsic colors and allowing us to measure their distances, ages, and metallicities.
Our first step was to use the Skynet telescopes to take images of each cluster in two different color filters: blue (B) and red (V-I). I then used Cluster Pro Plus, a powerful data analysis software, to identify and cut out any field stars that were not part of the cluster and to measure the magnitudes and colors of the remaining stars. I then plotted the B-R vs V and V-I vs R color-magnitude diagrams (CMDs) to identify the different stellar populations within the clusters, such as the main sequence, the turn-off point, and the red giants.
Next, I added in archival data from Gaia, a space telescope that can image much deeper than ground-based telescopes, and 2MASS, a near-infrared survey of the sky. I used Cluster Pro Plus to fetch and plot the Gaia and 2MASS data in the BP-RP vs G and J-K vs H CMDs, respectively. This allowed us to better model the faint end of the main sequence for open clusters and the turn-off point for globular clusters and to place additional constraints on our modeling.
However, since I had four different data sets to match but only two graphing areas to work with, I had to keep switching out what I was plotting until I arrived at a single solution that worked for all four data sets. This required some trial and error, but I eventually arrived at the best solution for each cluster. Once I had our final CMDs, I used Cluster Pro Plus to measure the distances, ages, metallicities, and reddening values (E(B-V)) for each cluster.
Finally, I used Cluster Pro Plus to subtract the effects of dust and obtain the intrinsic colors of the stars in each cluster. I adjusted the midtone and background levels, saved the images at full resolution, then rotated/flipped them to the correct orientation and made any final brightness/light level adjustments before cropping/reframing them to our liking. I then compared the images to our HR Diagram plots, identifying the different stellar populations in each cluster, such as the blue stars of the upper main sequence, the red giant stars, and the horizontal branch stars.
Overall, our project to image and analyze three different star clusters was a huge success, thanks to our use of Skynet telescopes, Gaia, and 2MASS data and the powerful data analysis capabilities of Cluster Pro Plus. By constructing high-resolution images of each cluster and measuring their physical properties, I gained a better understanding of the different stages of stellar evolution and the complex processes that led to the formation of these beautiful astronomical objects.

NGC 3293
NGC 3293 is a young, open cluster located in the Carina constellation, about 8,000 light-years away from Earth. It is estimated to be around 10 million years old and is home to over 100 bright, hot, and massive stars.
Using the PROMPT-5 telescopes from the Skynet network, I was able to capture images of NGC 3293 in the B, V, R, and I filters. I used Afterglow to align and calibrate the images and then plotted the stars on an HR diagram. I then estimated the cluster's age to be around 10 million years based on the location of the turn-off point on the HR diagram.
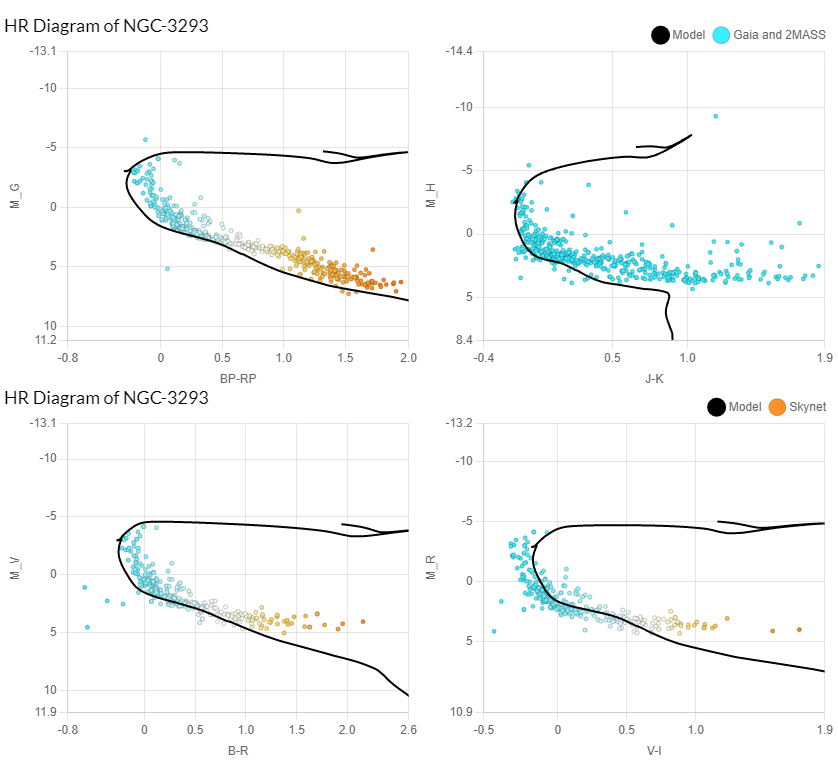
After analyzing our data, I found that NGC 3293 has an E(B-V) value of 0.37, indicating significant reddening due to interstellar dust. I also calculated the cluster's distance to be around 8,000 light-years and its metallicity to be slightly lower than the Sun's.
By subtracting the reddening caused by interstellar dust, I was able to obtain an image of the cluster's intrinsic colors. In this image, I could see the massive, hot, and blue stars of the upper main sequence and the fainter, cooler, and redder stars lower down the main sequence.

NGC 3960
Next, I observed NGC 3960, an intermediate-age open cluster located in the constellation of Centaurus, about 2,100 light years away from us. Our Skynet observations captured stars in the B, V, R, and I filters, allowing us to create a color-magnitude diagram and study the cluster's properties.
Using Afterglow, I aligned and calibrated our images and then selected only the stars within the cluster's region of interest. I applied cuts to remove foreground and background stars, and then measured the cluster's distance, age, metallicity, and extinction.

I got the measurements for NGC 3960 were a distance of 2,100 light years, an age of 370 million years, a metallicity of -0.19, and an extinction of 0.26.
When I plotted our Skynet data alongside archival data from Gaia and 2MASS, I refined our measurements and better understood the cluster's properties. I identified the turn-off point, the main-sequence, and the red giant branch in the resulting HR diagram. I also observed that NGC 3960 had a relatively high metallicity compared to other open clusters.
Finally, by subtracting the cluster's measured extinction, I was able to see its intrinsic colors and create a beautiful color-combined image. In the image, we can see the cluster's stars shining brightly against a dark background. The stars' colors allow us better to understand their properties and the cluster's evolutionary history.

NGC 5024
NGC 5024, also known as Messier 53, is a globular cluster located in the constellation Coma Berenices. It was discovered by Johann Elert Bode in 1775 and is estimated to be around 22000 light-years away from Earth.
With the Skynet telescopes, I was able to capture images of the cluster in the B, V, and R filters. Using the same techniques as with the previous clusters, I was able to create a color-combined image of NGC 5024. The image revealed a central concentration of bright, red giant stars surrounded by fainter, blue stars.
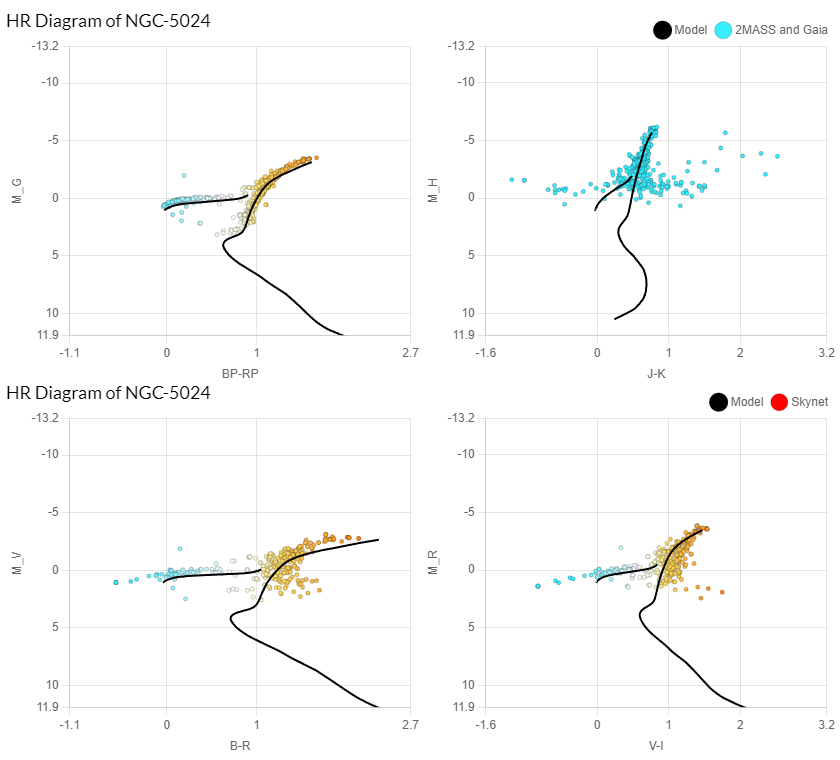
Using the HR diagram constructed from our data, I estimated the age of the cluster to be around 12 billion years old. I also measured a metallicity of -2.03, indicating that the cluster is very old and likely formed early in the history of the Milky Way.
To further refine our measurements, I used archival data from Gaia and 2MASS. With these additional data sets, I was able to better model the faint end of the main sequence and the turn-off point. I also measured the cluster's distance to be approximately 56,000 light-years away and an extinction of E(B-V) = 0.13.
After subtracting out the effects of dust using our measured E(B-V) value, I was able to see the cluster's intrinsic colors. The resulting image showed a clear horizontal branch populated by bright, bluer stars as well as fainter, redder stars.
Overall, our analysis of NGC 5024 showed it to be a very old globular cluster, likely formed early in the history of the Milky Way. Its clear horizontal branch and central concentration of bright, red giant stars make it a fascinating object to study and observe.
ACKNOWLEDGMENTS
I would like to thank my Professor, Dr. Reichart, and my TA, Mae Dubay, for the opportunity to capture these amazing images and the opportunity to access the amazing telescopes within the Skynet Network! Also, special thanks to my group mates for all of their help and support throughout this process!